20 / 24

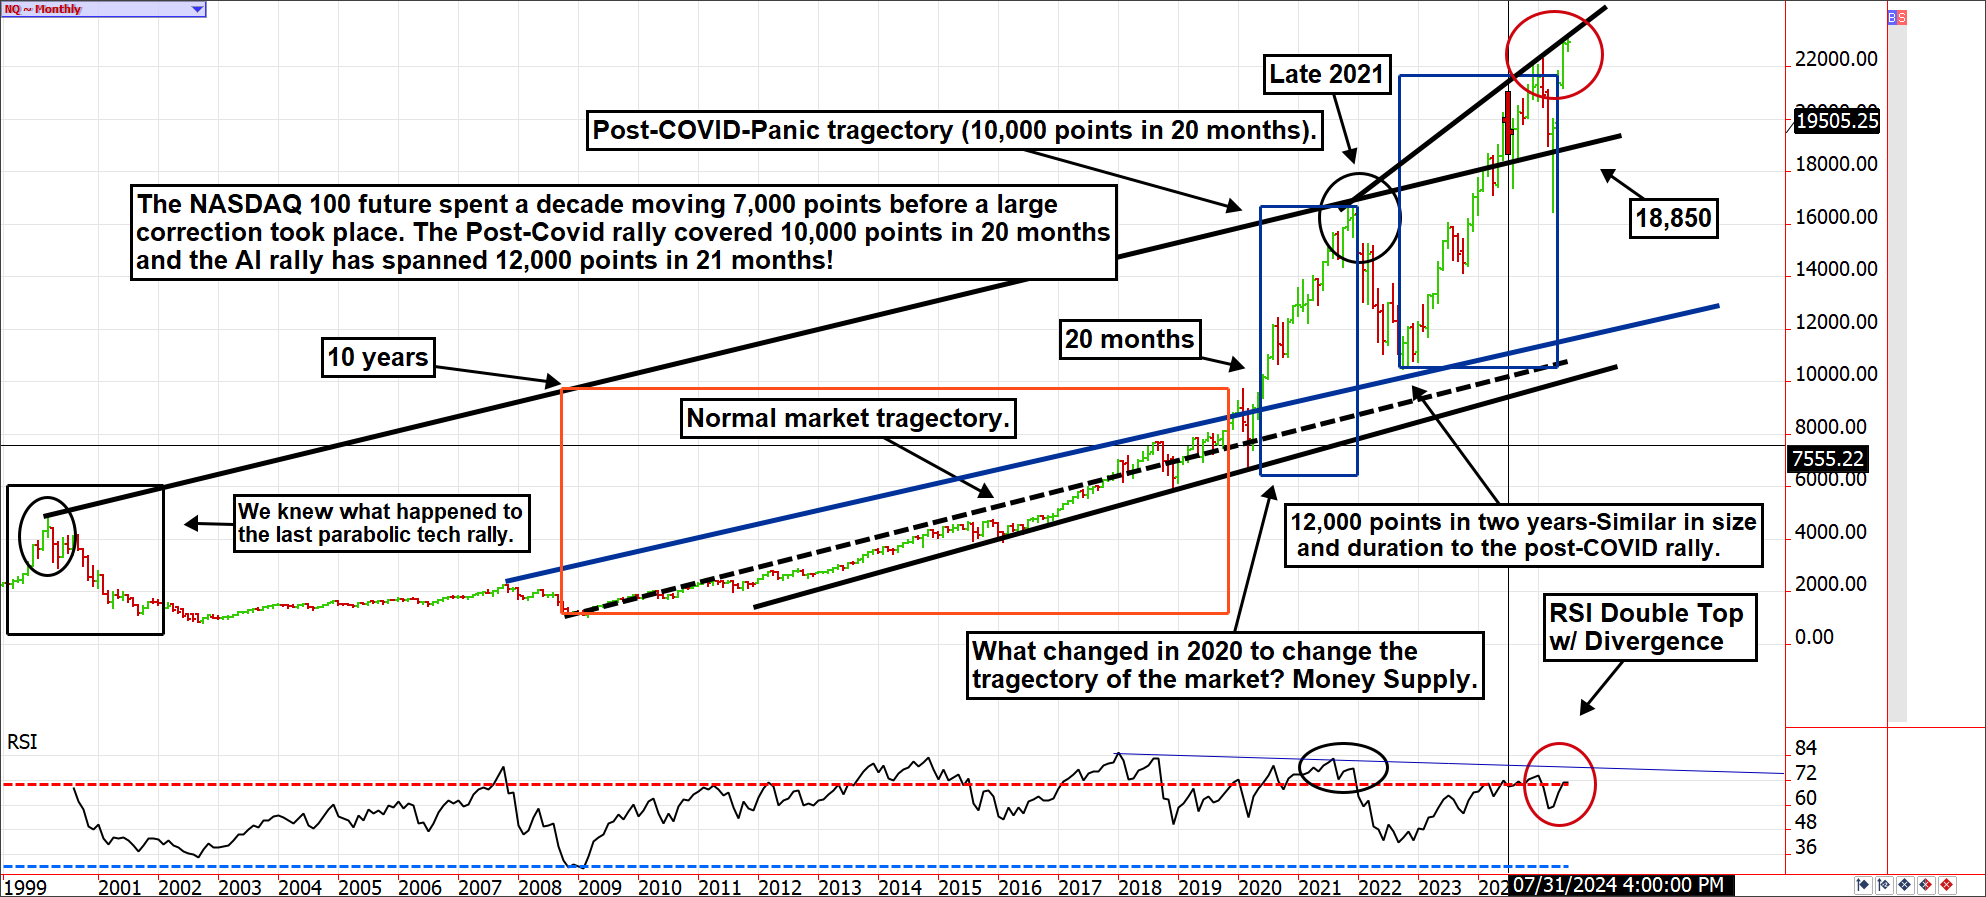
NASDAQ 100 ~ Monthly
I'm not telling you to tap the brakes on your stock exposure, but I think this chart might be. This is a monthly look at the NASDAQ 100. There is a double top with divergence (higher market highs but lower indicator highs) in the RSI, and we are approaching trendline resistance.
